Carbon Emissions (CO2 or carbon dioxide) are one of six greenhouse gases (GHG) in our atmosphere. These GHG’s allow sunlight to pass through and trap heat, known as “the greenhouse effect,” and this natural phenomenon keeps our planet temperate and comfortable. However, too much carbon emissions are a concern because they amplify the greenhouse effect and prevent infrared radiation from escaping the earth’s atmosphere into space. This is a dangerous situation for our planet and a threat to life on earth.
This article will cover how, since 1900, carbon emissions have increased exponentially. In the last 60 years, it is 100x faster than the previous naturally-occurring increases at the end of the last ice age. High-income countries produce an alarming and disproportionate amount (2x - 3x more) of carbon emission per capita. We’ll look at CO2 emissions by country and which emit the most and least. We’ll learn that the United States is responsible for emitting 399 billion tons carbon dioxide and is among the top industrialized countries contributing to worldwide carbon emissions.
We’ll examine the most significant sources of these emissions, such as burning fossil fuels for heat, electricity, and transportation (30% global greenhouse gas emissions is heat and electricity). We’ll cover carbon reduction and climate change policies around the world that have been implemented to combat the ill-effects of too much carbon dioxide in the earth’s atmosphere. Finally, we’ll check in with how the Pandemic has changed things (for the better) and what YOU can do to reduce your carbon footprint.
Article Contents
- Carbon Emissions Definition (CO2, Carbon Dioxide, GHG): What Are Carbon Emissions, and Why Does Carbon Footprint Matter?
- CO2 / Greenhouse Emissions & Carbon Footprint by Country: Which Countries Produce the Most Carbon Emissions?
- Greenhouse Gas Emissions by Source: Which Energy Source Generates the Most / Least Greenhouse Gases?
- Progress in Reducing Emissions: Carbon Reduction and What Can YOU Do?
The Editor’s picks below will give you an at-a-glance view of the stakes at hand and answer your questions like: What are carbon emissions? Why does carbon footprint matter?
We’ll break it down for you starting with the definition of carbon emissions. We’ll provide data about co2 and greenhouse gas emissions by country and source, as well as stats on CO2 per capita and progress being made by Europe and other countries towards carbon reduction.
Statistics (Editors Picks)
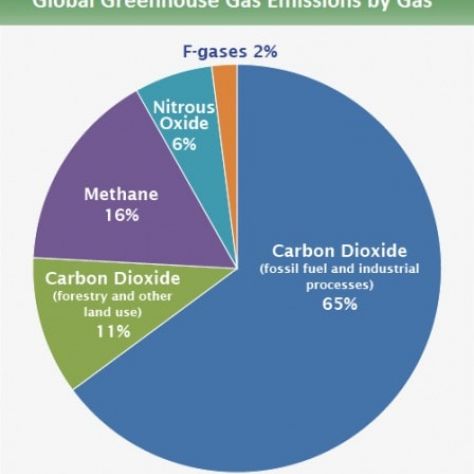
- Carbon Emissions (CO2 or carbon dioxide) are one of six greenhouse gases (GHG), and CO2 accounts for more than half of them (65%)
- CO2 is released into our atmosphere by both natural and human-related sources
- Cumulative global CO2 Emissions are over 36.58 metric tonnes and has risen over 60% in the last 25 years.
- The annual rate of atmospheric CO2 increase in the last 60 years is 100x faster than the previous naturally-occurring increases at the end of the last ice age.
- As we increase carbon emissions faster than mother nature can keep up, we hasten our planet earth’s demise; that depends on the right balance of greenhouse gases in its atmosphere to keep it hospitable to sustain life.
- Before the industrial revolution, our oceans were a net source of carbon dioxide (net sources of carbon dioxide absorb more CO2 than they emit), but as they absorb CO2, it’s altered the ocean’s PH, and we now have ocean acidification. CO2 solubility is temperature-dependent, and the changes in surface water temperature wreak havoc not only for marine life but for human life.
- Between 1751 and the United States alone released 399 billion tons of carbon dioxide and emitted over 15 billion metric tons carbon dioxide/year.
- When we look at the CO2 emissions by country, China has surpassed the United States and is one of the top 5, including India, Russia, and Japan.
- Europe is making progress towards carbon reduction, and Denmark tops the list by having ambitious goals such as being fossil-fuel-free by 2050 and being half-reusable energy efficient by 2030
- Bhutan, located between two of the highest polluting countries China and India, is the only country net-zero carbon country
- 30% of all global greenhouse gas emissions are heat and electricity and are growing, followed by transportation at 28.9% (transportation includes burning fossil fuels for cars, trucks, ships, trains, and airplanes).
- Starting in 1990, the wealthiest 1% account for 2x-3x more carbon dioxide emissions, a disproportionate amount from the poor.
- Since 1997, the number of global climate change policies and laws has increased 20x
Carbon Emissions Definition (CO2, Carbon Dioxide, GHG)
What Are Carbon Emissions, and Why Does Carbon Footprint Matter?

The definition of carbon emissions can be explained as one of the six greenhouse gases that trap heat from the sun and warm the earth. Carbon emissions are also referred to as CO2 or Carbon Dioxide (a colorless, odorless, non-toxic gas made up of carbon + oxygen created by carbon combustion). Carbon emissions occur when carbon is released into the atmosphere as part of a naturally-occurring process. When the ocean releases carbon dioxide into the atmosphere or animals and plants “breathe” and release carbon dioxide or decompose plants and animals. Mother nature keeps things in balance for us. But when human factors such as the burning of fossil fuels such as coal, natural gas, and oil, or using electricity, or deforestation, and other things we do as part of our daily lives, it creates potential threats that affect our planet.
Six Greenhouse Gases
1. Water Vapor (H2O) = water in a gas form
- creates clouds and brings rain back to earth, causing a cooling effect
- too much traps heat and which causes evaporation
2. Carbon Dioxide (CO2) = carbon and oxygen and is around all around us
- comes from decaying and living organisms and volcanoes
- carbon emission is the biggest contributor to human-caused GHG’s and is a byproduct of burning fossil fuels like coal and oil
3. Methane (CH4) = carbon and hydrogen
- natural gas released the use of natural gas as an energy source as well as from cattle ranching, rice agriculture and methane gas is also produced by wetlands
- The second biggest contributor to human-caused GHG’s
4. Ozone (O3) = ozone in our atmosphere
- blocks the sun’s radiation and protects us from harmful rays
- ozone too close to the earth and caused by cars and factories act as a GHG
5. Nitrous Oxide (N2O) = nitrous oxide is a natural part of the nitrogen cycle
- Naturally comes from bacteria in soil and the ocean
- too much damages the ozone layer and is released by some types of factories, power plants, and plant fertilizers
6. Chlorofluorocarbons (CFCs) = chemicals made up of carbon, chlorine, and fluorine atoms.
- not naturally-occurring - used to make aerosol sprays, blowing agents for foams and packing materials, as solvents, and as refrigerants
- damage the protective ozone layer and are powerful GHG’s
Natural Sources of CO2 Emissions Include:
- Decomposition - when plants and animals decompose, organisms within soil respire to produce energy and release CO2 into the atmosphere
- Ocean release and respiration - the oceans, which cover 70% of the earth, account for the largest exchange of CO2 and the atmosphere.
- Plants that release oxygen during photosynthesis are also responsible for releasing CO2.
- Animals breathe in oxygen and breathe out carbon dioxide.
Human Sources of CO2 Emissions Include:
- Cement production
- Deforestation
- Burning of fossil fuels like coal, oil, and natural gas
Typically, when people discuss “carbon emissions” and “carbon footprint,” they mean the dangerous kind created by human activity. The phrase “carbon footprint” refers to how much carbon dioxide (measured in tonnes) is released by an individual's use of electricity and fuel. Interestingly, the wealthiest 1% of people have 2x - 3x the carbon footprint than that of the poor.

Why Does Carbon Footprint Matter?
Carbon footprint matters because when the natural balance is altered, it disrupts animals’ natural habitats, rising sea levels, and other harmful effects on the environment and our future.
Earth is very fortunate in that it has a stable atmosphere that keeps it habitable. At the moment, it’s the only planet in our solar system that sustains life. However, this can change over time, and as we burn fossil fuels at a rate faster than mother nature can keep up, we put our future existence in jeopardy.
In the last several hundred years, the burning of fossil fuels has increased the amount of carbon dioxide released into the atmosphere at a far greater rate than plants, soil, and oceans can absorb. It’s important to know that fossil fuels contain carbon created over millions of years by plants that pull carbon out of the atmosphere during photosynthesis*).
* Photosynthesis = when sunlight combined with the chlorophyll in green plants and some other organisms synthesizes foods from CO2 and H2O and produces oxygen.
Oceans that cover 70% of the earth play an important role in absorbing CO2 from our atmosphere. Before the industrial revolution, our oceans were a net source of carbon dioxide (net sources of carbon dioxide absorb more CO2 than they emit). Unfortunately, to keep up with human-driven increases in carbon emissions, when the ocean does its job to pull CO2 from the atmosphere, it changes the sea’s PH. It changes the surface temperature of the ocean. When the oceans’ PH is altered, it’s called ocean acidification, and it wreaks all sorts of havoc for marine life. To further complicate matters, as the ocean absorbs CO2, it causes the water’s surface temperature to cool. The solubility of CO2 is temperature-dependent, so this is another problem as heat and radiation become trapped below the ocean’s top layer, which causes the ocean’s temperature to rise.

Key Statistics:
- CO2 (Carbon Dioxide) is the largest component (76%) of all greenhouse gases
- CH4 (Methane) is the second-largest component (16%) of all greenhouse gases
- N2) (Nitrus Oxide) is the third-largest component (6%) percent of all greenhouse gases
- Other greenhouse gases affect our atmospheric balance, but carbon dioxide (CO2) is, by far, the largest contributor to greenhouse gas emissions and reached a record-high in 2019 of 409.8 parts per million (ppm) or the highest it has been 800,000 years
- the annual rate of atmospheric CO2 increase in the last 60 years is 100x faster than the previous naturally-occurring increases at the end of the last ice age.
There has been an increase since the Industrial Age (mid-1700’s) with a significant rise 200 years later and a record high in 2019, as shown in the chart:

The amount of carbon dioxide in the atmosphere (raspberry line) has increased along with human emissions (blue line) since the Industrial Revolution in 1750. Emissions rose slowly to about 5 billion tons a year in the mid-20th century before skyrocketing to more than 35 billion tons per year by the end of the century. NOAA Climate.gov graph, adapted from original by Dr. Howard Diamond (NOAA ARL). Atmospheric CO2 data from NOAA and ETHZ. CO2 emissions data from Our World in Data and the Global Carbon Project.
CO2 Emissions Time Line
The Industrial Revolution was a catalyst for an increase in carbon emissions, and the impact from Industrialized nations since then has been exponential. Between 1751 and the United States alone released 399 billion tons of carbon dioxide and emitted over 15 billion metric tons carbon dioxide/year.
ICE AGE
For millions of years, CO2 emissions never exceeded 300 ppm, as evidenced by CO2 air bubbles found in mile-thick ice cores.
INDUSTRIAL REVOLUTION
The Industrial Revolution was an exciting time and brought many new inventions, including more forms of transportation. But it also brought the burning of fossil fuels, which caused an increase in carbon emissions. The average increase per year since mid-20th-century was .17%. This was also when deforestation in tropical areas started to occur, depleted the earth’s photosynthesis process.
1979 - 2019
You can see a massive jump in the chart above. The NOAA Earth System Research Laboratory indicates that there has been an average increase of 1.84 ppm per year during the last 40 years. But the rate is accelerating alarmingly fast.
2009 - 2019
To illustrate this, CO2 jumped from an increase of 1.84 ppm to a rise of 2.4 ppm in the last decade (more than 30% jump).
2019 - 2020
The annual increase went from 2.4 to 2.64 (another 10% increase). This is over a 44% increase in less than 50 years.

- Concurrent to the increase in CO2 particles in the atmosphere, the global average temperature is more than 1℃ higher since pre-industrial times.
- The correlation between carbon emissions and global temperatures is what causes alarm. When carbon emissions are trapped in our atmosphere, they amplify the greenhouse effect, which in turn, causes the earth to be warmer. This increase in temperature disturbs the natural balance. It causes climate change, which creates disturbance of animals' natural habitats, rising sea levels, extreme weather, and other negative impacts that threaten our future. Other greenhouse gases contribute to this phenomenon as well, but CO2 is the biggest culprit.
- Another reason carbon emissions matters are because of ocean acidity. The ocean pH has a 30% increase in acidity because it is absorbing more carbon dioxide.
- Between 1992-2018, oceans have absorbed 7.4 billion tons or 67 billion metric tonnes of CO2
- The wealthiest 1% per capita contribute 2x - 3x the carbon footprint than lower-income individuals
Sources:
https://climatekids.nasa.gov/greenhouse-cards/
https://www.epa.gov/ghgemissions/global-greenhouse-gas-emissions-data
https://dictionary.cambridge.org/us/dictionary/english/carbon-emissions
https://www.climate.gov/news-features/understanding-climate/climate-change-atmospheric-carbon-dioxide
https://www.theguardian.com/environment/2020/sep/21/worlds-richest-1-cause-double-co2-emissions-of-poorest-50-says-oxfam
https://www.carbonbrief.org/guest-post-the-oceans-are-absorbing-more-carbon-than-previously-thought
https://www.nature.com/articles/358738a0
https://esrl.noaa.gov/gmd/aggi/aggi.html
CO2 / Greenhouse Emissions & Carbon Footprint by Country
Which country has (produces) the most carbon emissions?
399 billion tons of carbon dioxide between 1751 and 2017 were released by the United States per the Global Carbon Project. China produces the largest carbon footprint and is the most prolific producer of greenhouse emissions (over 6 billion tons or 5.41 billion metric tons), making it the world’s biggest polluter. The United States distinguishes itself as the second-largest producer of greenhouse gases and CO2 emissions with over 7.5 billion tons or 6.8 billion metric tons). The United States used to be the country with the most carbon emissions until China surpassed the US in 2006. Russia and India are among the least environmentally-friendly countries.
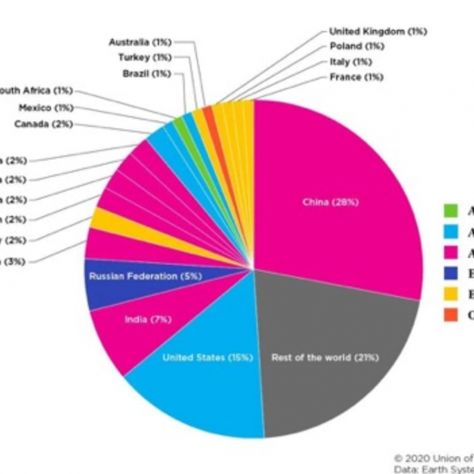
The total global CO2 Emissions is over 40 tons or 36.58 metric tonnes and has risen over 60% in the last 25 years. Here are the percentages of greenhouse gas pollution by country:
Carbon (CO2) Emissions by Country:
China 28%
United States 15%
India 7%
Russian Federation 5%
Japan 3%
Germany 2%
Islamic Republic of Iran 2%
South Korea 2%
Saudi Arabia 2%
Indonesia 2%
Canada 2%
Mexico 1%
South Africa 1%
Brazil 1%
Turkey 1%
United Kingdom 1%
Poland 1%
Italy 1%
France 1%
Rest of the World 21%

Which country absorbs more CO2 than it gives off?
Bhutan, located between China and India in the Eastern Himalayas, is the only country that absorbs more CO2 than it gives off due to its forestation and environmentally-friendly policies. New policies started in 2009 to make Bhutan environmentally-friendly, such as planting trees, hydroelectric power to decrease reliance on fossil fuels reliance, and many other green initiatives to make the country carbon negative!

Denmark is at the top of the list of countries doing the most to protect the environment. It continues to set ambitious goals, among them having at least half its energy consumption come from renewables by 2030 and to be independent of fossil fuels by 2050.

Key Statistics:
- Bhutan absorbs 7.7 million tons or 7 million metric tonnes of CO2 per year
- Bhutan produces 2.2 million tons or 2 million metric tonnes of CO2 per year
- 72% of Bhutan is a forest with a policy not to go below 60%
- Bhutan set a world record in 2015 when 100 Bhutan’s planted 49,672 trees in one hour! Even more, trees have been planted since then.
- By 2030, Bhutan plans to not only reach zero net greenhouse gas emissions by relying on renewable sources such as water, wind, and biogas.
Sources:
https://www.indiatoday.in/education-today/gk-current-affairs/story/bhutan-worlds-only-carbon-negative-country-1261119-2018-07-12
https://www.gviusa.com/blog/bhutan-carbon-negative-country-world/
https://www.ted.com/talks/tshering_tobgay_this_country_isn_t_just_carbon_neutral_it_s_carbon_negative?language=en
Greenhouse Gas Emissions by Source
Which Energy Source Generates the Most / Least Greenhouse Gases?

Which energy source contributes the most to climate change?
The energy source that generates the most greenhouse gas emissions (that are considered to affect climate change) is the burning of fossil fuels for heat and electricity and is ranked in this order:
- Coal
- Oil
- Natural Gas
Greenhouse gas emissions (CO2 or carbon dioxide make up most emissions, but smaller amounts of CH4 methane and N2O nitrous oxide are also emitted) are released when fossil fuels are burned for energy used for electricity, heat, and transportation. Coal is the energy source that produces the most pollution and accounts for 80% of power plant carbon emissions. Burning coal creates carbon emissions in addition to smog, soot, and acid rain. Natural gas releases 29% of greenhouse gas emissions in the US, but it emits 30% less CO2 than oil and 43% less than coal.

Which energy source generates the least greenhouse gases?
Renewable energy sources do not release any greenhouse gas emissions and not a source of carbon dioxide gas because only the oxidation or burning of fuels during the release of energy releases greenhouse gases.
- Hydro
- Wind
- Solar

It is important to note that virtually no greenhouse gases are released from nuclear energy.
Greenhouse Gas Emissions by Economic Sector
The highest source of greenhouse gas emissions based on sector is electricity and heat production, ultimately accounting for 25% of all greenhouse gas emissions.
- Electricity and Heat Production = 25%
- Agriculture, Forestry and Other Land Use = 24%
- Industry (emissions produced by the burning of fossil fuels primarily at energy facilities) = 21%
- Transportation = 14%
- Other Energy (the process of extracting fuel, refining, and processing) = 10%
- Buildings emissions = 6%
Key Statistics:
- In the last 150 years, nearly all greenhouse gas emissions are emitted via human activities.
- US total GHG emissions = 7,360 million tons or 6,677 million metric tons in 2018
- The largest source of carbon emissions in the US is:
- from the burning of fossil fuels for electricity (30%)
- heat, transportation including cars, trucks, ships, trains, and airplanes (15%)
- manufacturing and construction (12%)
- Natural gas (which releases 30% less CO2 than oil and 42% less than coal) is responsible for 29% of released greenhouse gases in the US.
- Solar, wind, and hydro energy release no carbon emissions
Sources:
https://www.epa.gov/ghgemissions/sources-greenhouse-gas-emissions
https://www.eia.gov/energyexplained/energy-and-the-environment/where-greenhouse-gases-come-from.php
https://www.che-project.eu/news/main-sources-carbon-dioxide-emissions
https://www.enovaenergygroup.com/which-types-of-energy-source-produces-the-most-pollution/
https://www.eesi.org/topics/fossil-fuels/description
https://brainly.in/question/6690513
https://quizlet.com/151543810/biology-chapter-5-flash-cards/
https://www.epa.gov/ghgemissions/global-greenhouse-gas-emissions-data
http://onlineborders.org.uk/community/carbonreduction/carbon-emissions-carbon-footprints-explained
https://www.greenmatters.com/p/how-do-carbon-emissions-affect-environment
https://www.wri.org/blog/2020/02/greenhouse-gas-emissions-by-country-sector
https://earthhero.com/carbon-emissions/
Progress in Carbon Reduction
What Progress Has Been Made Towards Climate Change Policies Around the World?
Many climate change policies around the world have sprung into place since 1997, which is a 20-fold increase indicating that the issue of carbon emissions is pressing.
The Kyoto Protocol was put into place in 1997 by the United Nations to limit carbon emissions and greenhouse gases in industrialized countries and economies. What progress has Europe made towards meeting the requirements of the Kyoto protocol? The European Union has reduced emissions by 24% as its economy grew 60% in the last 40 years; however, the Kyoto Protocol ultimately failed as Europe and 17 out of 36 countries could not meet the requirements. In 2021, it was formally rejected by the United States.
The Paris Agreement, with pledges to reduce carbon emissions by 2030, has been met with a similar fate as the Kyoto Protocol. The climate change policies around the world have yet to achieve carbon reduction goals; however, here are the stats of progress to date are below.
Key Statistics:
- The European Union has reduced emissions by 24% as its economy grew 60% in the last 40 years.
- Carbon reduction of 3.7% in Europe was achieved between 2018 and 2019
- Climate change policies put into place by the EU Emissions Trading System (EU ETS) resulted in the most significant declines at power plants.
- From 2018 - 2019, the system helped reduce emissions by 9.1% from stationary installations in all countries covered by EU ETS.
- Unfortunately, emissions from transport, buildings, agriculture, and water (not covered by EU ETS were unchanged during the same period.
- Europe made progress in the aviation sector as well, although International CO2 emissions from flights outside the European Economic Area increased 3% in 2019
What is Carbon Reduction? How to Reduce Your Carbon Footprint.
Carbon reduction is often interchangeably used with “carbon footprint” (greenhouse gasses that you as an individual’s everyday activities including the use of electricity, driving a car, flying in a plane, etc.). There are numerous ways you foster carbon reduction and reduce your carbon footprint. We’ve highlighted some key suggestions for you to try. If we do our little part for the collective good, then we can make a difference not just for ourselves but also for our amazing planet’s future life.

Lifestyle Changes to Help Reduce Your Carbon Footprint:
Here are a few suggestions you can try.
- REFUSE: Opt-out of single-usee plastic and paper products
- REDUCE: Avoid excess and only purchase things that you need
- ROT: Create a compost system for food scraps or drop off your compostables at a facility that processes them
- RECYCLE: Check your local recycling policies and follow the procedures for glass, plastic, metal, and other recyclables
- Switch to sustainable energy sources
- Use less electricity
- Buy energy-efficient appliances and equipment.
- Sign up for energy-saving programs
- Conserve water
- Clean up your local community and pick up trash, especially around waterways
- Try using reusables instead of disposables (glasses, plates, cutlery, etc.)
- Carpool or use public transportation
- Install solar panels at your home
- You can even purchase carbon credits from reputable organizations that dedicate your dollars to carbon-offsetting projects.
In addition, you can read about additional efforts to reduce environmental impact here.
Carbon Emissions Since Coronavirus
As the worldometers and live coronavirus updates continue to bombard us with the coronavirus mortality rates, there is one small consolation. Calculations indicate that carbon emissions since coronavirus have dropped 7%. However, this decrease will likely be eclipsed by the surge of carbon emissions in 2021 and beyond as things normalize and countries rebound from the pandemic crisis.
Sources:
https://www.gaiam.com/blogs/discover/how-does-your-carbon-footprint-impact-climate-change
https://ec.europa.eu/clima/policies/strategies/progress_en
https://www.carbonbrief.org/mapped-climate-change-laws-around-world
https://quizlet.com/247746518/lesson-4-regional-geography-ctc-flash-cards/
https://climatekids.nasa.gov/greenhouse-cards/
https://www.iea.org/reports/global-energy-review-2020/global-energy-and-co2-emissions-in-2020
https://www.epa.gov/ghgemissions/global-greenhouse-gas-emissions-data
https://dictionary.cambridge.org/us/dictionary/english/carbon-emissions
http://onlineborders.org.uk/community/carbonreduction/carbon-emissions-carbon-footprints-explained
https://www.gardenbenches.com/blog/reduce-impact-environment/
https://www.scientificamerican.com/article/why-a-historic-emissions-drop-from-covid-is-no-cause-to-celebrate/
Conclusion
It’s shocking to learn that well-educated, wealthy people account for 2x-3x the carbon footprint of poor people. The acceleration rate is 100x faster in the last 60 years than in the previous million years. A silver lining of the global pandemic and COVID-19 crisis precipitated by travel restrictions and carbon emissions has slowed and decreased by 7% in 2020. However, this is only a tiny blip that will soon be eclipsed as things come back. The stats speak for themself, and if we don’t address carbon emissions, then we put our planet's survival at risk.

Sources:
http://onlineborders.org.uk/community/carbonreduction/carbon-emissions-carbon-footprints-explained
https://brainly.in/question/6690513
https://climatekids.nasa.gov/greenhouse-cards/
https://dictionary.cambridge.org/us/dictionary/english/carbon-emissions
https://earthhero.com/carbon-emissions/
https://ec.europa.eu/clima/policies/strategies/progress_en
https://quizlet.com/151543810/biology-chapter-5-flash-cards/
https://www.carbonbrief.org/guest-post-the-oceans-are-absorbing-more-carbon-than-previously-thought
https://www.carbonbrief.org/mapped-climate-change-laws-around-world
https://www.che-project.eu/news/main-sources-carbon-dioxide-emissions
https://www.climate.gov/news-features/understanding-climate/climate-change-atmospheric-carbon-dioxide
https://www.eesi.org/topics/fossil-fuels/description
https://www.eia.gov/energyexplained/energy-and-the-environment/where-greenhouse-gases-come-from.php
https://www.enovaenergygroup.com/which-types-of-energy-source-produces-the-most-pollution/
https://www.epa.gov/ghgemissions/global-greenhouse-gas-emissions-data
https://www.gaiam.com/blogs/discover/how-does-your-carbon-footprint-impact-climate-chang
ehttps://www.greenmatters.com/p/how-do-carbon-emissions-affect-environment
https://www.gviusa.com/blog/bhutan-carbon-negative-country-world/
https://www.iea.org/reports/global-energy-review-2020/global-energy-and-co2-emissions-in-2020
https://www.indiatoday.in/education-today/gk-current-affairs/story/bhutan-worlds-only-carbon-negative-country-1261119-2018-07-12
https://www.nature.com/articles/358738a0
https://www.ted.com/talks/tshering_tobgay_this_country_isn_t_just_carbon_neutral_it_s_carbon_negative?language=en
https://www.theguardian.com/environment/2020/sep/21/worlds-richest-1-cause-double-co2-emissions-of-poorest-50-says-oxfam
https://www.wri.org/blog/2020/02/greenhouse-gas-emissions-by-country-sector
https://www.cnbc.com/2020/12/11/covid-record-drop-global-carbon-emissions-2020.html
Join the conversation
You Might Also Like


60+ Facts About Plastic Pollution in the World and Our Oceans (2023)
_500_300_84_s_c1.jpg)
Airplane Emissions and Air Travel Carbon Footprint Statistics

Car Sale and Automobile Statistics (2023)

How Many Flights Per Day? Airline and Flight Statistics (2023)

How Many People Travel a Year? 30+ Travel Statistics (2023)

LGBT Statistics: How many people are gay, lesbian, bisexual and transgender?

Travel and Tourism Statistics: What Are the Most Popular Countries to Visit? (2023)

What is Same Sex Marriage? 10+ Gay Marriage Statistics

When Was Homosexuality Decriminalized? LGBT Statistics & More

Why Are People Gay? Homosexuality Stats, Myths & Stereotypes (2023)

Drunk Driving Statistics: How Many Drunk Driving Deaths in 2023?


